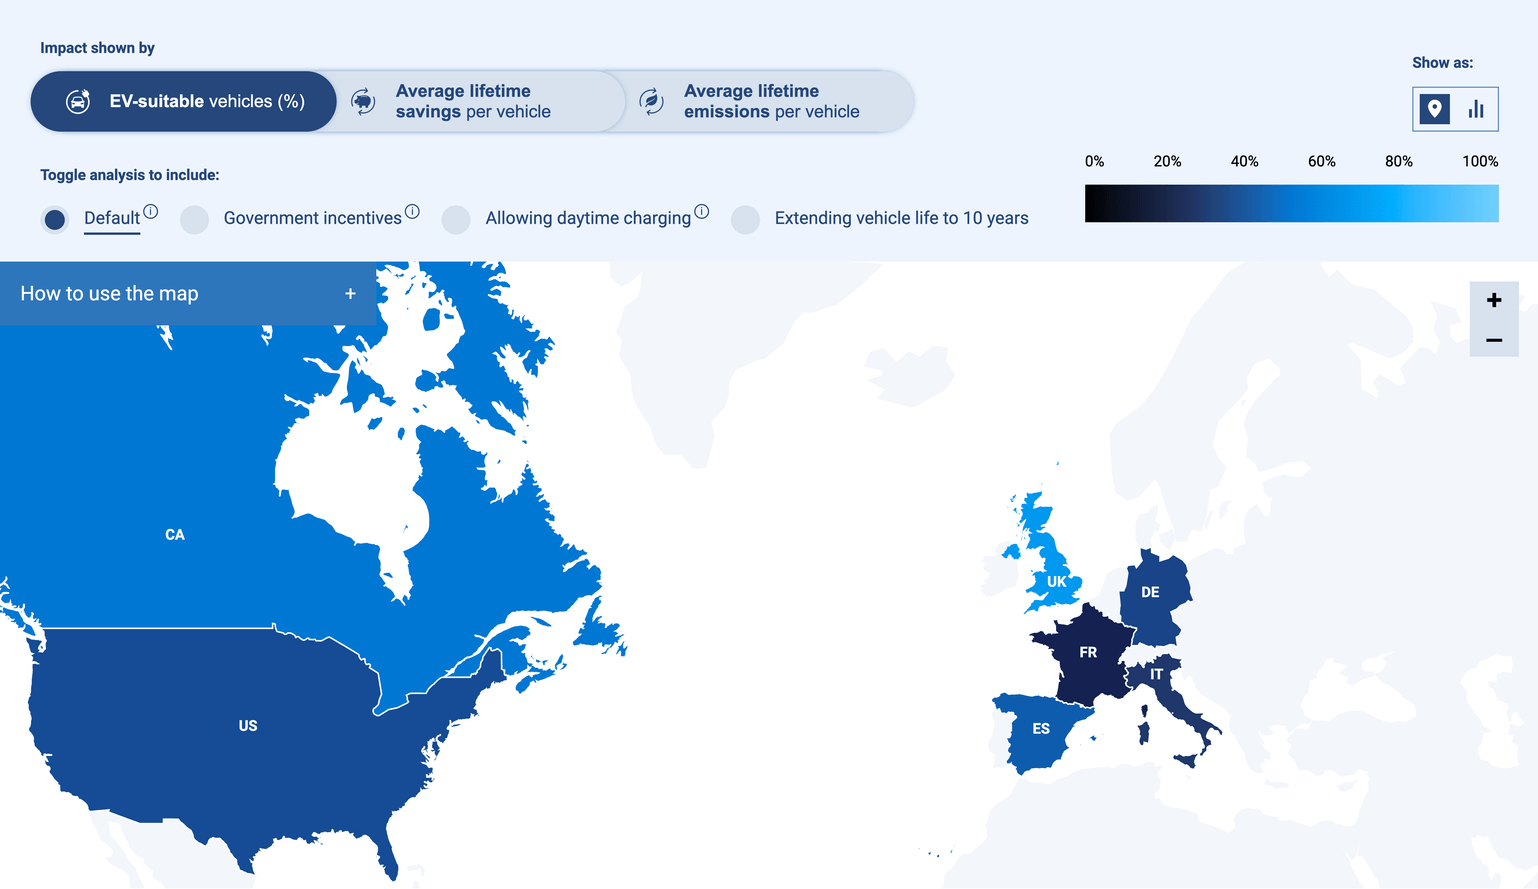
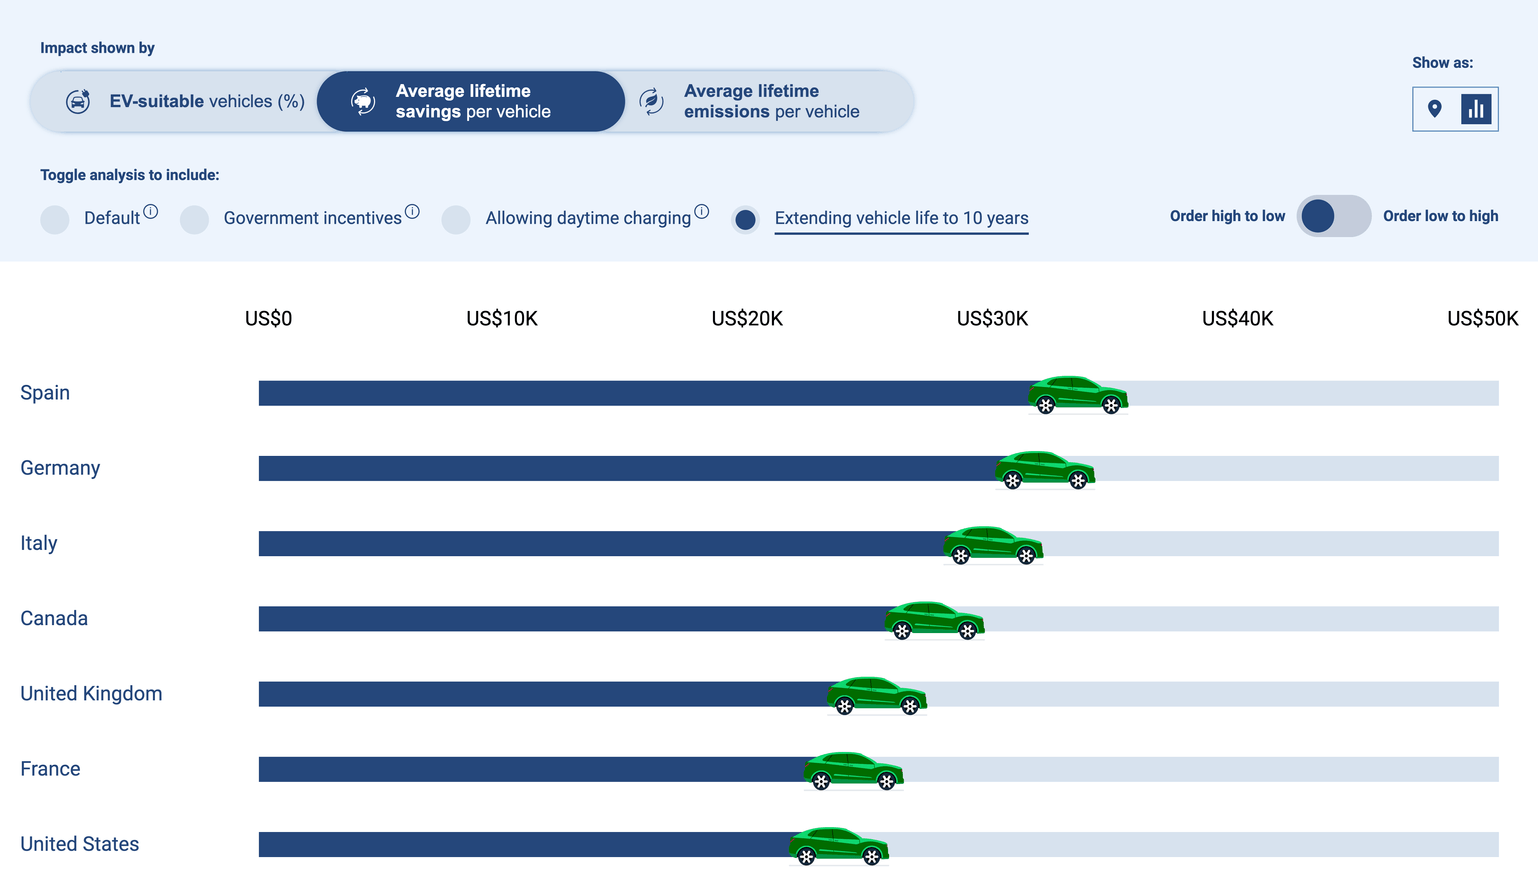
Geotab is an industry leading telematics company that specializes in connecting commercial vehicles to the internet, and providing web-based analytics for fleet management. The Electric Vehicle Suitability Assesment (EVSA) tool is one of their sustainability solutions to help enable fleets to go electric and improve their environmental performance. Our data visualisation project supported the EVSA tool by illustrating the potential benefits of converting to EVs.


The application consisted of a control dashboard which allowed users set variables to synchronously display the resultant data in an engaging way, in either map or chart form. The map uses a colour gradient to intuitively display values, and the bar charts automatically organize countries into ascending or descending order to allow easy comparison.
The website was built using D3.js, TypeScript, and Vite. This includes creating the tooltips, bar charts, and interactive map. All these elements are all dynmically generated so that any additional input data, or any input data changes, are reflected automatically in the applicaiton.


